Multi Neighborhood Cellular Automata Portal
What is MNCA portal?
MNCA portal is a supporting dashboard for the NMI paper - "Paper title"
Here you will find all code and material to reproduce the paper work. It is divided into multiple parts. Each part corresponds to a Google Colab notebook where you can create your own version of code and run all cells.
Ready with the poster for NORA 2023 Tromsø conference🚀 with @stenichele and Aarati. @NORAdotAI pic.twitter.com/hL4qHkx6ZP
— Sanyam Jain (@s4nyam) May 30, 2023
Media, Conferences, and Poster
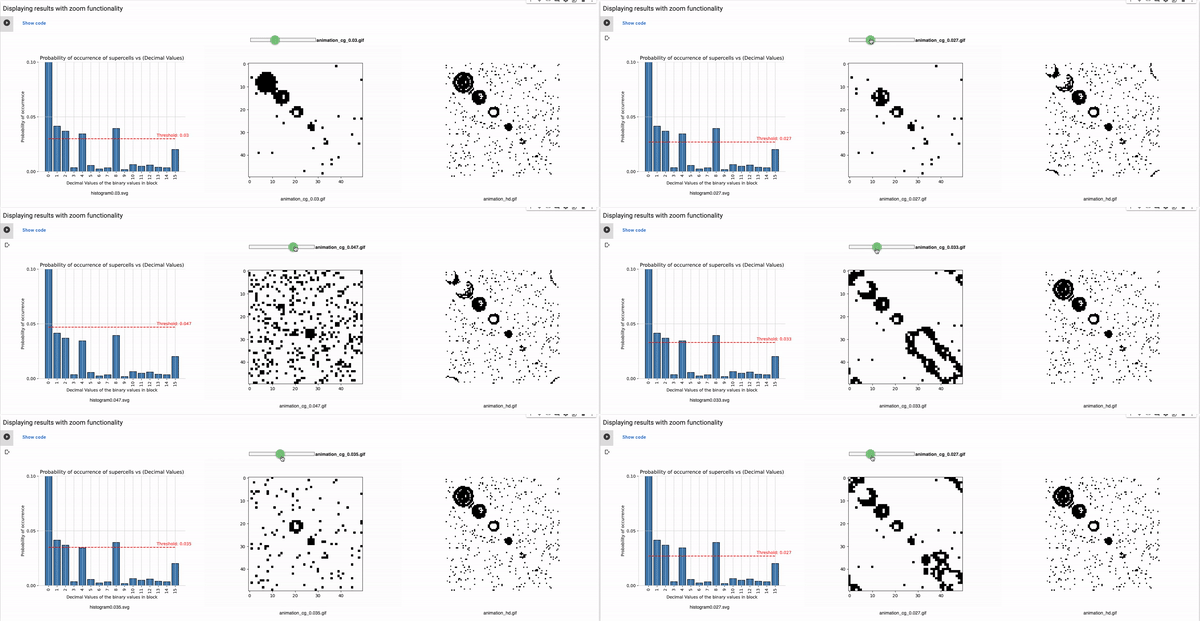
 ⭐Animations of MNCA, Multi-state MNCA, etc here!⭐
Datasets
 ECA Generalised Dataset Zip (2.55GB)
 ECA Auto-Thresholding Dataset (400 MB)
Many of the 256 possible rules for ECA are equivalent to each other under certain transformations. One such transformation is the reflection through a vertical axis, which results in the mirrored rule. When you apply this transformation to a given rule, the behavior of the automaton will be the same up to this reflection, making the two rules computationally equivalent. Because of these equivalences, there is no need to simulate each of the 256 rules independently. Instead, you can represent each class of equivalent rules using the minimum representative rule from that class. By doing so, you significantly reduce the number of rules that need to be simulated and save computational resources. For example Rule 30 (equivalent to 86, 135, 149)
 ⭐ ECA Auto-Thresholding Dataset Minimum Equivalence best for visualisation (30 MB) ⭐
 ⭐ Download All Multi Neighborhood CA project files from my Research Asst. (5 GB) ⭐
slackermanz's portal (ref)
 Evolve new rules using DEFLATE as fitness for Genetic Algorithm
 Evolve new rules, save animation (Code for SLURM/Cluster)
 Visualise Evolved rules
 RBN FHCG - Code Notebook for No Aggregation
 RBN FHCG - No Aggregation results
 RBN FHCG - Code Notebook for Aggregation
 RBN FHCG - Aggregation results
Colab Notebooks (MNCA + RBN)
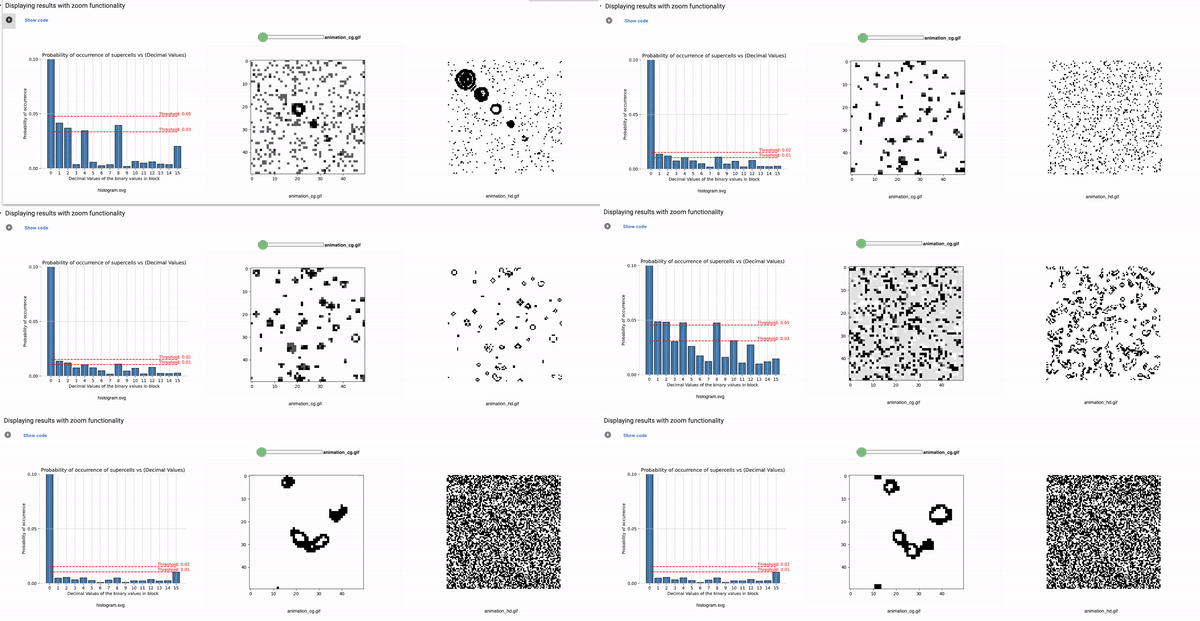
 Part1: Binary FHCG MNCA Google Colab

Definition of the variables for setting the configuration
blocksize: Size of the block that is used for coarse graining. For example, a block size of 2 will reduce the size of the grid to half, i.e., a 100x100 grid will reduce to 50x50. These values can range from 2 to 4, in our implementation (shared parameter for the rest of the known rules).
Thresholds: List of all thresholds that are considered for visualizations such that each threshold has a horizontal line in the histogram.
width: Grid size width, default 100 (shared parameter for the rest of the known rules).
height: Grid size height, default 100 (shared parameter for the rest of the known rules).
steps: Time steps for which the simulation of CA runs. For example, 9 steps equal 9 frames of simulation with 9 respective updates (shared parameter for the rest of the known rules).
initial_state_probability: The density of pixels populated initially for the starting frame.
seed_value: This value initializes the random pixels for the board as same in simulations. Default is 1, if changed, the behavior will be different. It preserves the states, so that the same pixel density could be understood for histograms and FHCG (shared parameter for the rest of the known rules).
maximum_plot_thresh_fhcg: This value decides the limit of the y-axis so as to skip extra high bars to increase the readability of the FHCG plots (shared parameter for the rest of the known rules).
 Part2: Multi State FHCG MNCA Google Colab

 Part3: Elementary CA Generalised Thresholding

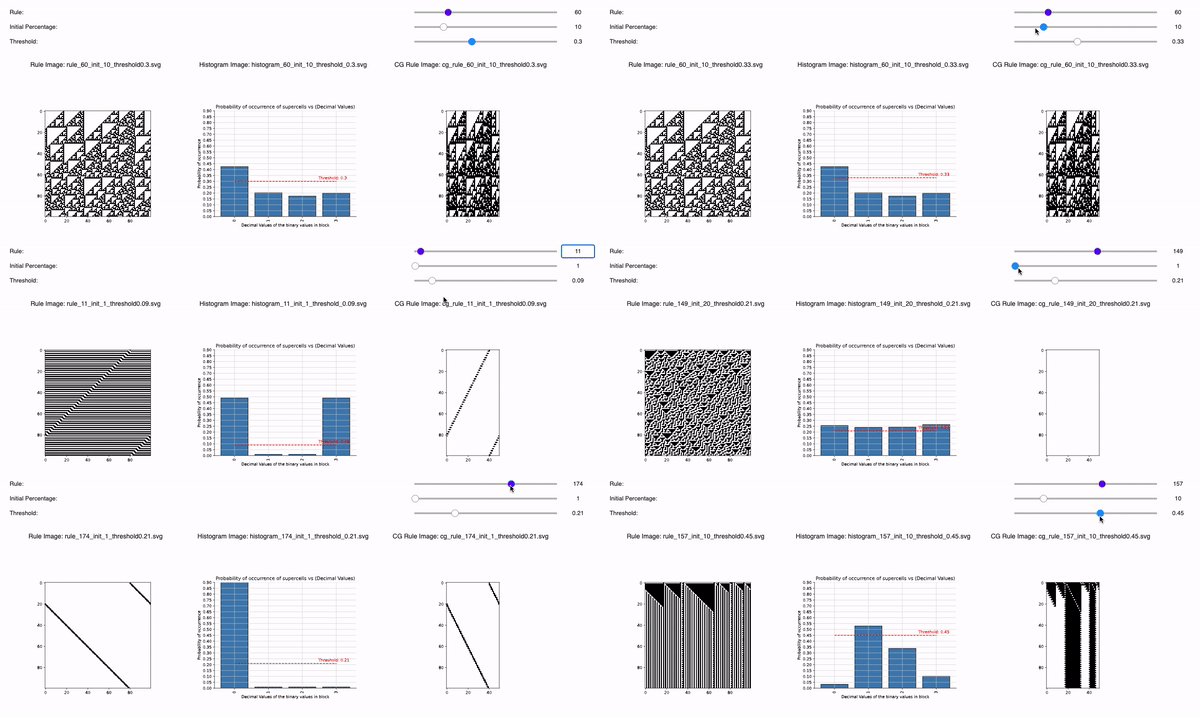
Following are the three sliders that can help you to tweak 1D CA Rules, Initial Percentage, and Threshold:
1D CA Rules: Ranging from 1 to 255 for 1D CA. All possible rules for 1D CA are downloaded and displayed with a seed value of 1.
Initial Percentage: The amount of alive pixels in the first iteration of the simulation. For example, if the Initial percentage is 1, that means the CA will be initialized with only 1 pixel in the start. It will be placed randomly but with seed=1 so that all time the CA is initialized the same. The values range from initial_percentages = [1, 10, 20, 30, 40, 50].
Threshold: It defines the alpha value that is discussed in the paper [Cisneros et al 2021]. This value is displayed as a bar in the plots of the histogram and sets an alpha or threshold value up to which the coarse blocks are considered and replaced with a binary value depending on its probabilistic appearance in the volumetric information.
The reason why the whole coarse graining goes white with a threshold being between the 0th bar and rest of the bars, for example, with the configuration of rule 60, initial percentage 10, and threshold at the 13th number slider, will show coarse graining filtered as normal and show all live pixels with FHCG working fine. However, if you move the slider above, let's say at the 15th number, the coarse graining becomes white-out because at that position the threshold is 0.45 and FHCG now includes whitespace as a majority or, in other words, the frequency of the whitespace is in the majority and hence it is expected to have whiteout in most of the coarse-grained output.
 Part4: Elementary CA Auto-Thresholding
 ECA Genearlised-Thresholding Dataset Creator Notebook
 ECA Auto-Thresholding Dataset Creator Notebook
 ECA Auto-Thresholding Dataset Creator Notebook with single histogram per initialisation
Affiliations

Sanyam Jain, Stefano Nichele
Venue

